
------------------------------
Virginia Precipitation and Stream Flow for the 7-day Period Ending October 14, 2014by araflo |
Below are images showing precipitation in the southeastern United States and stream flow in Virginia over the seven-day period ending October 14, 2014. The Virginia Water Resources Research Center thanks the agencies mentioned below for providing precipitation and stream-flow information and images. For monthly reviews of precipitation, stream flow, and drought, please see the News Grouper posts available at this link: http://
Precipitation
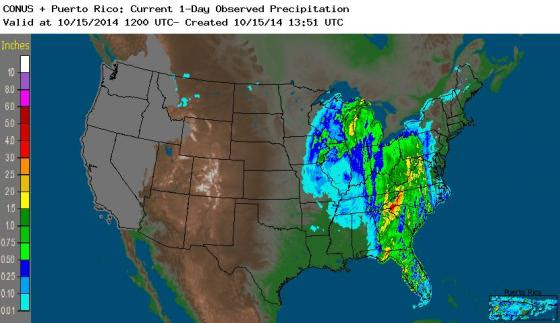
The following maps show southeastern U.S. precipitation amounts over the past seven days (top map), and the percent of normal precipitation for the given location at this time of year (bottom map). The maps were accessed on 10/15/14 from the National Oceanic and Atmospheric Administration’s (NOAA) Southeast Regional Climate Center, located at the University of North Carolina in Chapel Hill; online athttp://www.sercc.com/


For another precipitation-information source: The National Weather Service’s Advanced Hydrologic Prediction Service, http://water.weather.gov/

Stream Flow
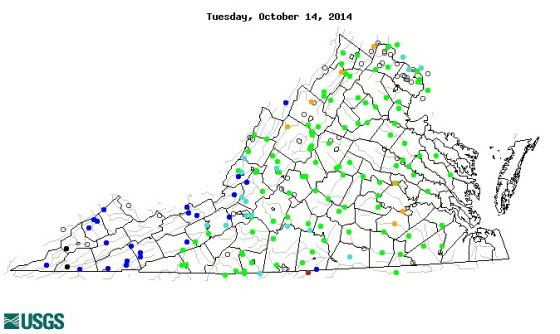
Average Virginia stream flow over week ending October 14, 2014, is indicated in the map below, from the U.S. Geological Survey WaterWatch for Virginia (online athttp://waterwatch.usgs.gov/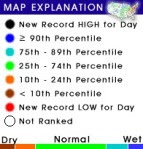


No comments:
Post a Comment